Brought forward: 279.38
forecast estimate: 307.31
Actual: 327.10
Percentage gain/loss: +14.58%
June forecast estimate: 359.81
Brought forward: 279.38
forecast estimate: 307.31
Actual: 327.10
Percentage gain/loss: +14.58%
June forecast estimate: 359.81
Order: Pending Sell Stop
Instrument: GBPJPY
Entry: 189.176
SL: 190.176
TP: 186.976
APP: yes
R/R ratio: 1:2.1
Signal: Bearish spinning top/big number rebound at 190.000
Trade activated at 1900 hours.
SL taken out. Loss of -10.61

Your R/R ratio is the second most important element of forex money management next to your account leverage. Risk and reward relates naturally to the sizes of the stop (SL) and take profit (TP) levels. The main rule of thumb is that clearly it is not financially sound to be risking more than your expected return on investment (ROI). Therefore it is far better to have a ratio at least if not larger than 1:1.
The most common ratios are 1:2, 1:3 and possibly 1:4 risk to reward. Beyond this is way too big. What will determine the TP would be:
1. Your style of trading such as short term verses long term i.e. Scalper/day trader or longer.
2. Particular currency pair. As we know by using the 'average true range' (ATR) indicator which gives us a clue as to what to expect in movement on any given time frame (TF).
What it boils down to is:
1. You do not want the trend to exhaust and reverse then potentially taking out your SL, or being stuck in a trade longer than is necessary. For me personally most of the time I trade the D1 TF along with the fact I like the 'cable' pairs due to their volatility. So here is how I work it.
Risk = 100
Reward = 220
Therefore R/R is 1:2.1 which for example may pan out like this:
220 x 3 = 660 pip win
100 x 3 = 300 pip loss
Therefore 50% win rate = 360 pips
Lose 3 more trades.
100 x 3 = 300 pip loss
Result of winning EVEN only 33.3% of the time.
360 - 300 = 60 pips
Question, even with reasonable trade judgement decision would it not be impossible, to be correct at the very least 33.3% most of the time once you average out your trades?
Is the GBPJPY price action on course to intersect the 161.8% fibonacci expansion level?

Order: pending buy stop
Instrument: GBPJPY
Entry: 189.197
SL: 188.197
TP: 191.397
APP: yes
Market Sentiment: Bullish.
Signal: Inverted hammer candle.
----------------------------------------------------
UPDATE: trade activated 1900 hours.
-----------------------------------------------------
290515/0615 Manual close - profit = 6.73.

Since this trade is still actively pending I have decided to keep it that way for the time being. With the exceptional amendment to the entry, sl and tp levels to coincide with the close of last week's D1 candle. Which are:
Entry: 189.753
SL: 188.753
TP: 191.953
This is surely tentative and could end in being terminated since the trade now has a bearish tendency. So a OCO could well take place here.
Order: Sell Stop
Instrument: GBPJPY
Entry: 187.833
SL: 188.833
TP: 185.633
As Per Plan
R/R ratio: 1:2.1
Signal: Bearish long line candle on D1.

When it comes down to the broader perspective picture of the forex market gameplay there are either buyer's or seller's. Now amongst the collective participants in play there maybe more buyer's than seller's and other times more seller's than buyers. This is the natural cycle, but in either case there will always be a larger sentiment on a given side, whether buyer's or seller's.
So who is correct?
The masses or those who oppose the conventional wisdom especially when the concensus opinion appears to wrong. There is an inherent danger in following the 'herd' at times since this mentality creates in the economic world 'financial bubbles' such as the mass home loan purchases which eventually escalated into the ill fated GFC.
Yes this was of cause madness on a big scale but the danger of herd mentality was behind it all, and as such happens often on a small scale also. Contrarians tend to oppose the conformist and as such wait diligently for the inevitable 'market correction'. You need to look no further at the logical power of this in action when studying the greatest contrarian investor of all time than Warren Buffet.
So what has this to do with the forex market?
Simply we go against the mass perspective, and we do this via a very informative tool which goes by the name of the 'speculative sentiment index' which along with any of the given major pairs shows us in which direction the market sentiment is being held most.
The forex analysis site Dailyfx has a SSI graph on one of its pages along with a statistical breakdown and reasoning of number crunched data which gives a very clear high probability of a pair's movement bias. The link of which is here.
Order: pending buy stop
Instrument: GBPJPY
TF: D1
Entry: 190.107
SL: 189.107
TP: 192.307
As Per Plan
R/R ratio: 1:2.1
Signal: Bullish power candle breaking prior resistance area 190.000
There is a ton of really interesting stuff on the web, adversely one might say there is also an awful lot of equally uninteresting things also but that would be beside the point.
One useful page I have come across recently which would be of use to many fellow traders is a forex compounding calculator on the forex21.com site.
All you need to enter in the fields provided are:
1. Your starting balance.
2. Percentage increase per month.
3. Number of months.
Then press the calculate button to reveal your (hopeful) expected ROI.
Below is the link:
http://www.forex21.com/forex-compounding-calculator/
This is a topic I have thought about covering for some time. It really is something close to heart so to speak because I like many did ignore it's intrinsic importance for quite some time. There is an old saying which states "to know and not to do is to not know at all". Meaning if you are aware of something that is of importance but ignore acting upon it you may as well not know of it anyway.
A journal is far more than just a record keeping ledger, it lies at the very 'core' of what makes you tick, kind of like a personal business diary. Drawing from my own experience I have found the very act of keeping a journal helps me to focus on what I need to achieve. So here are a few pointers as to what to include; now everyone is different and so therefore will execute this task with their own variation, which is fine since everyone is their own individual.
The process of (either manually or digitally) recording a forex journal or log is central to your currency trading career. I like many viewed it as a triviality, afterall your trades are backed up in the trading platform history. This is indeed correct, however this is purely statistical at best and says nothing regarding as to the personal logic and or reasoning for acting upon your course of action.
Here is the shortlist:
Before any event recording, fully detail your trading plan, this is your 'modus operandi'. Think of this as your 'trading constitution'. The pledge you make to yourself. Take the time and effort to fully explain the logic it entails. This will be different for everyone.
Start of entries:
1. Name the currency pair you're trading. Include entry price, stop loss and take profit levels.
(a) Is it market execution, buy limit/stop or sell limit/stop.
(b) Was it executed according to your plan? If not what was your reasoning not to do so?
(c) What was the signal for entering the trade therein. eg. candle formation, pattern, trend line break etc.
(d) If for any reason you need to change the levels then explain why you did so.
2. How do you feel about your course of action? eg. mood.
3. Possible fundamental logic for entering trade.
4. Goal setting. On the last day of each month record: last months balance brought forward, the forecast for the month and the actual balance achieved. In the beginning it will no doubt be better to be conservative with the forecast by projecting a 5% overall increase to last months balance. Once you have a ratio appearing then it can be adjusted occordingly.
Trust me when I say that by doing this it will give you a clarity and help you focus on the task at hand. It will keep you from going astray like making a stupid spontaneous trade which you'll later regret.
Trade your plan and plan your trade as they say. I wish you all the best.
In the forex stakes all is not equal, especially in respect to currency pairs. Majors for example move a lot more than exotic pairs, even when you isolate the majors it isn't exactly a level playing field either. Using just two examples on a D1 chart in reference to their respective ATR index we have (as of today).
GBPJPY with a range of 171 and
CADCHF with a range of 91.4 pips.
As we can see by the latter there is nothing fast and furious going on here. On the other hand king pin gbpypy is a different story. It is nothing to see this particular pair along with its equally volatile counterpart the gbpusd move 200 pips or more in one day, given the right fundamentals at play eg monthly NFP release.
All things being equal and naturally so a more volatile pair requires a larger stop than a low volatility pair. I might add though that this is not an everyday occurrence and even the gbp has an off day once and awhile.
Some quieter pairs can swim around in a metaphorical quadmire for days before reaching a take profit and even the occasional stop less. Hey that happens to the best of us from time to time. The point being that you can be in trade a lot longer in some pairs than you can in others which all effects your end of month target goal.
Slow moving pairs can be advantageous though, especially if you happen to be a complete newbie on a live account, because you can by referencing the ATR initiate a tighter stop loss.
Although it may be simple it is a very useful tool. The Average True Range calculates a candles high minus its low, adds together the last 14 results then averages that figure by 14. The formula is as follows:
Current ATR = [(prior ATR x 13) + current ATR / 14
The example below is of the eurusd on a H4 timeframe. The ATR here reads 0.00575, which equates to an average candle range of 57.5 pips.
The reason for it being called Average 'True' Range is that it also takes into account gaps that can occur between one candles close and anothers open, such as a when the market first opens on a new trading week.

Why would you only trade one pair at a time?
There are many small habits that can be detrimental to your success as a forex trader, none least of which is placing trades on multiple pairs at the same time. This habit is in fact no different from overleveraging which in itself is not sound money management.
Trading more frequently or trading more than one pair at a time just makes you lose focus and weakens your overall concentration. Always keep things simple, that's the rule. In forex there is no correlation between trading more equating to better profitability. It just makes more work in the long run.
Advantages of single currency pair trading.
1. It's less stressful.
2. A single pair can be allotted the full 2% leverage.
3. Every pair has its own idiosyncrasy and behaviour. Learn how it behaves when particular news related information is released especially when it concerns the two countries. Plus although I am not into indicators I do use an ATR (average true range) set on a 14 candle period. This of which will help you to set reasonable stop losses. Different pairs have varying degrees of volatility, which is important to observe.
4. To a lesser degree be vigilant of the pairs support and resistance levels no matter which timeframe you are trading from.
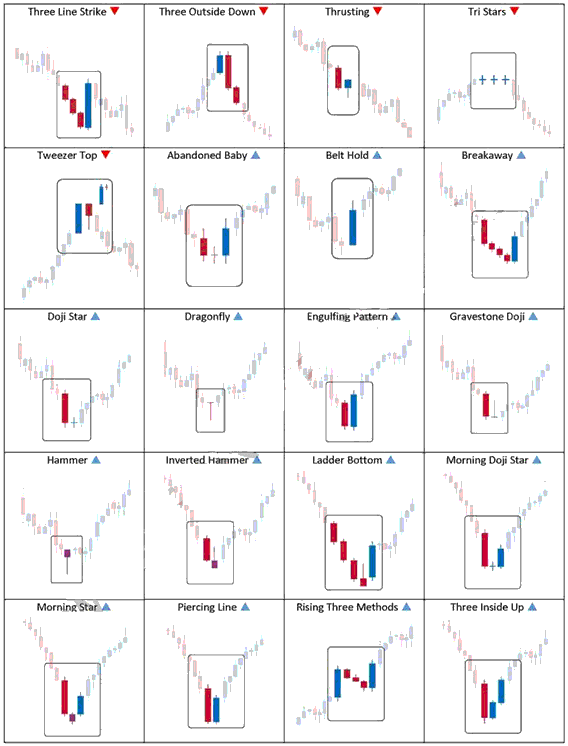
In price action trading knowing a trend is about to end and another pending reverse trend is imminent is a valuable forex skill to learn. Whilst certainty its movement is at times unpredictable the market does give tell tale clues as to it's direction via the formation of its candlesticks which act like a self fulfilling prophesy.
Included within this post therefore is a chart which includes the most essential candlestick patterns and formations which will undoubtedly be a valuable resource. Learn these and it will give you an inevitable edge in your forex career.